Information can give an organization a solid grasp on its past and future, but only if the data is accessible to those who need it. Executive dashboards make it easy to provide information—not just data—to those who need it.
Get the Scoop on Executive Dashboards >
Read on to learn how users can get the information they need with Sequel Data Access, so even non-technical users can understand the data. .
Executives, account managers, marketing analysts, and other business users who need data can open a customized dashboard from a link on their desktops, from a browser, or on a mobile device using Sequel Web Interface. These users control the dashboard and the data displayed on it, from general trends to specific details.
From a single dashboard, your users can compare year-end information, view quarterly numbers comparing the current year to the previous year, and select six months of data to assess.
When running the dashboard below, users are able to access all of the information they need from the dashboard.
The Technical Scoop
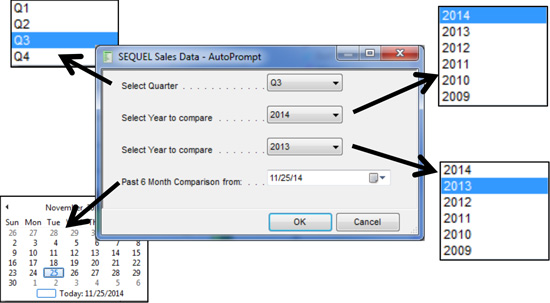
The trick is to make sure the Sequel objects (e.g., queries, reports) in the dashboard have variables defined with the same name, type, and length. If the variables are exactly the same, the inputted information will be shared between those objects. As shown below, we have four uniquely defined variables, which must be selected at runtime.
Example: When running this Beachboard Industries Sales Dashboard, you will need to select which quarter you want to compare between the current and past year. You’ll also select two years to compare total sales data, and you’ll select a date from which to compare the past six months of data.
Digging Into the Dashboard Details
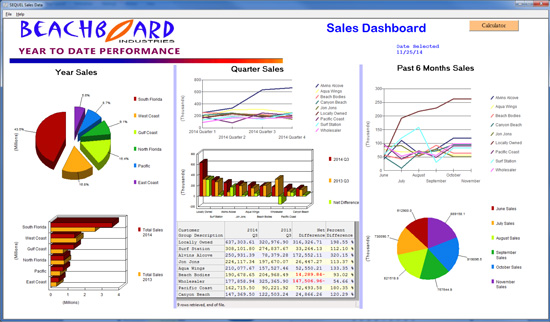
The result is a dashboard that includes information based on your record selection, which you can see in the image below.
The left column focuses on yearly sales, with one view running in the background to display multiple charts. The pie chart displays yearly sales by region up to the current date, and the bar chart includes data from the two years selected for comparison in the AutoPrompt.
The middle column focuses on quarterly sales, and includes different views based on the current date and the quarter selected in the AutoPrompt. The line graph shows sales figures for the past four quarters. The bar graph and spreadsheet both compare data from the current year to the previous year in the quarter selected in the AutoPrompt. The bar graph shows the net difference by region, while the spreadsheet includes the net and percent differences.
The right column focuses on monthly sales, with a view running in the background to display charts based on the date entered in the AutoPrompt. A line graph depicts sales data for the past six months by sales region, and the pie chart shows total sales for all regions over the six months preceding the selected date.
See what goes into creating a dashboard. Watch the webinar (and jump to 8:58 for a demo) >
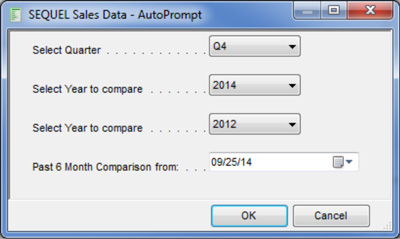
With the same dashboard, you can select the File option to be reprompted and collect new information, or you can choose to rerun the same dashboard and select different input variables for a different look.
Example: Select input values to compare the fourth quarter of this year to last year, compare year-end numbers year-over-year, and view six months of data at a time.
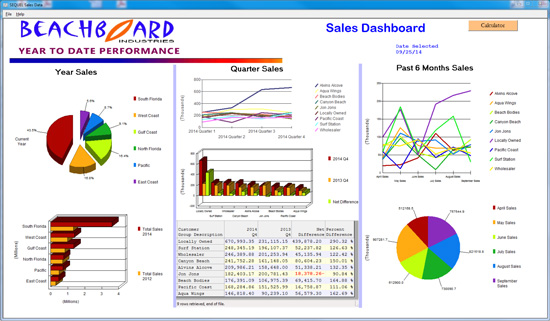
The result is the same dashboard displaying different information based on the variables selected in the AutoPrompt.
Why Use Dashboards?
Reviewing a dashboard or two like the one shown above can help business users analyze year-end data.
With monthly, quarterly, and yearly data available at a click of a button, your users can make better decisions in less time.
Sequel even lets you rerun the same dashboard or input new variables, so you can see your information from different angles. By empowering users with quick and easy access to data, you’re setting up your entire organization for success—now and into the future.
Get Started with Dashboards
Executive dashboards offer a terrific, user-friendly way to deliver data to anyone at your organization. Choose your path to getting started with dashboards today.