QSystems Management and MIMIX
QMessage Monitor
- There are a number of message queues within MIMIX. The main one is MIMIXQGPL/MIMIX.
- After the queue has been added, auto-reply rules can be created for the more critical messages, such as "Objects placed on hold", and so on.
- Authorization lists can also be used to minimize who actually sees the messages.
- Subsystem (MIMIXSBS) monitors can be created.
- Job monitors can be set up to ensure the product (MIMIX Manager) is running correctly.
- Job monitors should include monitor for jobs waiting on an inquiry message (*INQW).
- User Defined Bars could be created to monitor a whole range of metrics. MIMIX is extremely useful as it has a number of RTV* commands that allow all sorts of information to be retrieved and placed into user bars. Some of these are detailed below.
- Data group status.
- File entries on hold.
- File entries not active.
- File entries not journalled.
- Failed object activity entries.
- Object activity entries older than a certain time.
- Data group replication status.
- Replication is active.
- Replication is not behind.
- Remote journal lag.
- System and Journal Manager status.
- Applications can be set up within Disk Summary to monitor DASD utilization for the MIMIX application.
RTV* Commands
There are currently four RTV* commands that provide either system wide or data group level status data.
RTV Functioning normally
RTV Apply session not active
RTV Apply session backlog
RTV Data group status not active
RTV Communications failure
RTV Data area poller not active
RTV Database apply not active
RTV Database send not active
RTV Database send backlog
RTV File entries held error
RTV File entries not active
RTV Files not journalled on source
RTV Files not journalled on target
RTV IFS entries held error
RTV IFS entries held not error
RTV IFS entries not active
RTV IFS entries not journalled on source
RTV IFS entries not journalled on target
RTV Object entries held error
RTV Object entries held not error
RTV Object entries not journalled on source
RTV Object entries not journalled on target
RTV Object send not active
RTV Object send backlog
RTV Object retrieve not active
RTV Object retrieve backlog
RTV Container send not active
RTV Container send backlog
RTV Status send not active
RTV Object apply not active
RTV Object apply backlog
RTV Objects failed distribution
RTV Failed object entries
RTV Object beyond retry duration
User-Defined Bars
User supplied values allow you to write programs to add new data types to the monitor. You can have as many user supplied values as you like.
You write a program that fetches the data required. The program should use command MONAPUPD or MONTXUPD to pass the value to the monitor. Use MONAPUPD for numeric elements and MONTXUPD for text items.
Between collections, use the command MONAPWAT to wait for the next collection cycle.
Here is a minimal example program to demonstrate the idea:
PGM &INC
 DCL VAR(&INC) TYPE(*DEC) LEN(15 5) /* Increment amount */
 DCL VAR(&VALUE) TYPE(*DEC) LEN(9 2)
 LOOP: MONAPUPD VALUE(&VALUE)
      MONAPWAT
      MONMSG MON0000 *N RETURN
      CHGVAR &VALUE (&VALUE + &INC)
           GOTO LOOP
           ENDPGM
This program simply accepts an amount by which to count and keeps adding that value to the current value of the element.
Note the MONMSG for message MON0000 on the MONAPWAT command. MONAPWAT will issue an escape message when the monitor is ended. The program should monitor for this and end as shown.
Configuring the Element
Once your program is ready, create a new element in the usual way. Select one of the user supplied data types:
- Decimal. Value is a number with a fractional value.
- Integer. Value is an integer. If a fractional value is passed to MONAPUPD, it will be rounded up or down to the nearest whole number.
- Percentage. Value is a percentage, with decimals, which will typically be between 0 and 100; although this is not enforced by the monitor.
- Text. Value is a one or two character value, which will be translated to a description using a threshold.
Examples of MIMIX Monitoring
QSystem Monitor: Online Monitor, File Monitoring
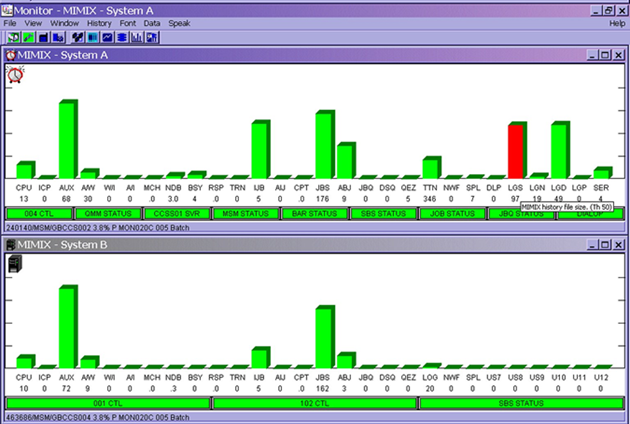
In the above example, we've attempted to show how the QSystem Monitor definitions could be used to monitor the size of a critical file within the MIMIX application. If this were a history file then automation could be used to purge the file when the threshold was reached.
QSystem Monitor: Online Monitor, Job Monitoring
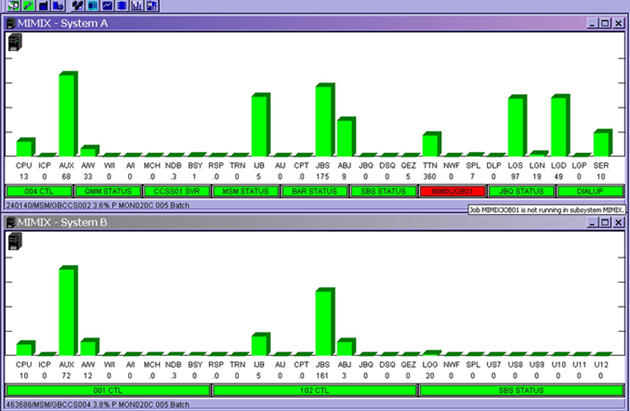
In the above example, we've attempted to show how the QSystem Monitor definitions could be used to monitor that critical jobs within the MIMIX application are active and running under the correct profile and in the correct status. If any jobs are not in their required status a message is sent in addition to the visual and audible alarms.
QSystem Monitor: Disk Summary, Application Monitoring
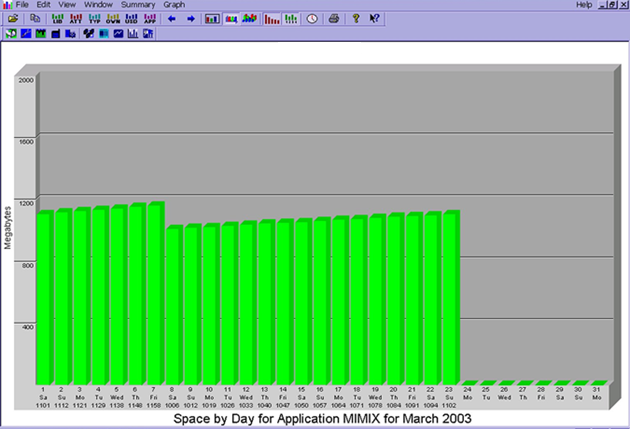
The disk summary allows the user to group together libraries into applications. In the above example, you can see how this could be used to monitor the size of the MIMIX application/data group.
QSystem Monitor: Disk and History Summary, Multi-Print Option
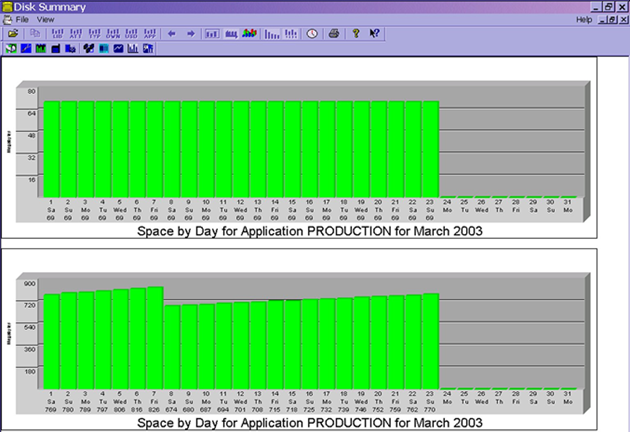
Both the Disk Summary and History Summary modules have a multi-print option which allows you to compare the statistics of a number of systems on the one graph. In the above example, you can see how this could be used to compare the size of the PRODUCTION application on two systems.
QMessage Monitor: Event Monitor
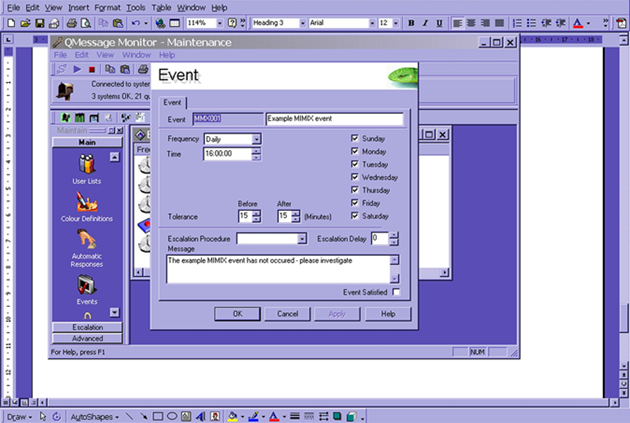
Here we can see how the QMessage Monitor Event Monitor can be used to ensure that critical jobs complete by a designated time. In this instance, a message is sent to warn the operators that the job has not yet completed; an alternative approach might be to start an escalation procedure.
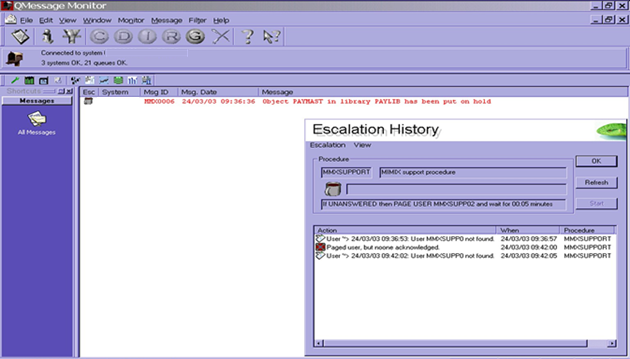
QMessage Monitor: Escalation Procedures
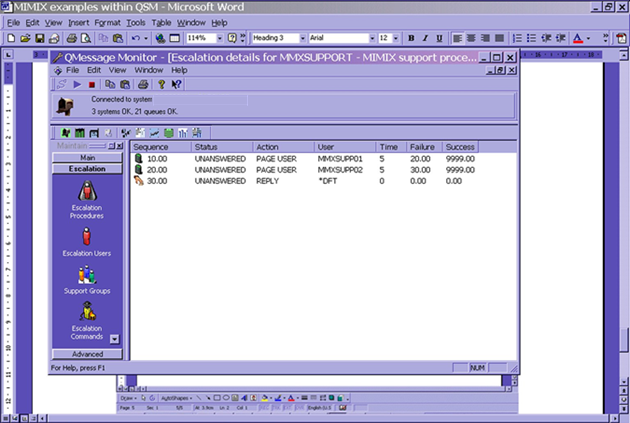
Here we have a simple escalation procedure that can either be attached to a message ID or an event, or started manually by an operator. The procedure will page two users, waiting five minutes between each page for the user to reply. If the message is still unanswered after this period, the product will issue a default reply.
QMessage Monitor: Automatic Responses, Filtering
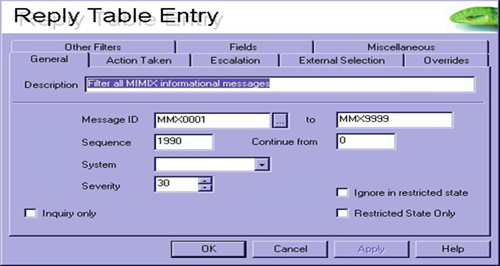
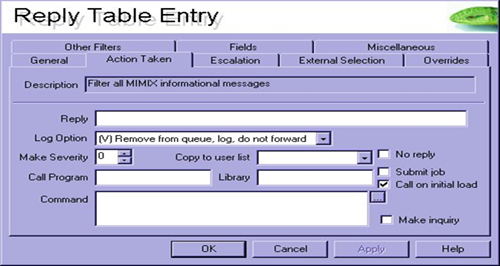
Here, one simple specification will prevent all messages up to and including severity 30 from being forwarded to the operators screen.
QMessage Monitor: Automatic Responses, Highlight Important Messages
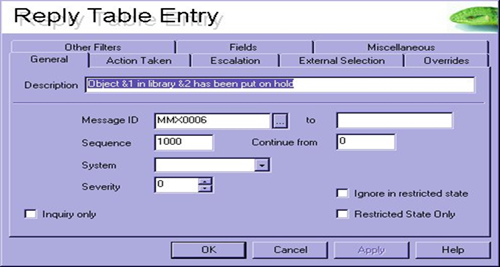
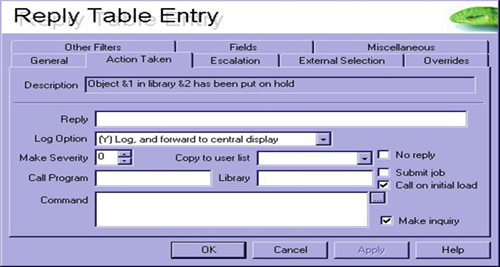
Here, we've defined MMX0006 as an automatic response. In the second image, we've identified the fact that we want this message forwarded to the central console and have also made it an inquiry message within QMessage Monitor.
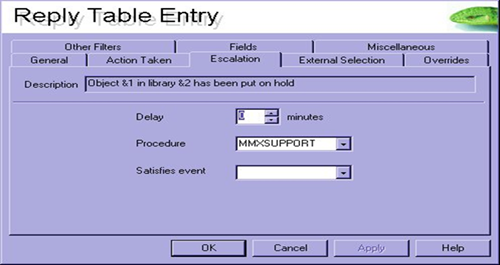
In addition to that, we've also indicated that we wish to run the escalation procedure MMXSUPPORT when the message arrives as shown in the third image.
This is how the message would appear to the operator viewing the console whilst the escalation procedure is running:
QRemote Control: Exit Programs
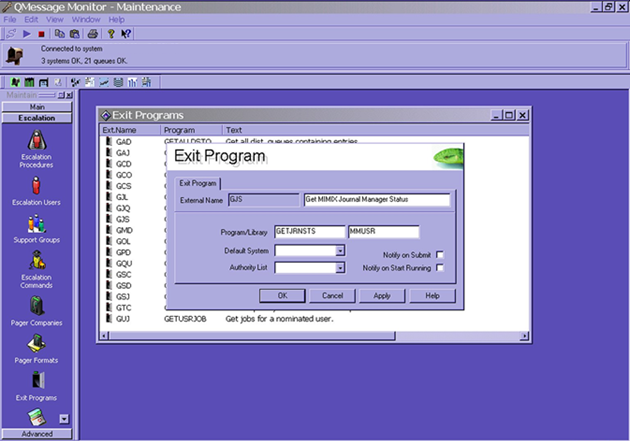
QRemote Control allows customers to write their own programs that can retrieve information and send it as an SMS message to a mobile phone. An example within a MIMIX application could be to retrieve the status of the Journal Manager as shown above.

