Historical performance monitoring and modeling across your IT environment
In an increasingly virtualized world, it’s becoming more and more difficult to understand performance across your IT enterprise. Performance Navigator performance analysis software allows you to see what’s truly occurring on your mission critical systems. With current day and historical performance data, you know exactly what’s going on with all your core performance metrics—including disk, memory, and CPU—and how to plan future capacity needs. No more guessing!
Data Collection without Additional Overhead
Performance Navigator is a graphical PC tool for performance analysis and capacity modeling for IBM i, AIX/VIOS, Linux, Solaris, and HP-UX workloads on IBM Power Systems, Oracle, and HP servers. Performance Navigator securely feeds data from Collection Services, NMON, and/or SAR to the Windows client nightly and updates the history files on your system—all proven to have little or no overhead.
After gathering all this juicy historical data into one place, Performance Navigator provides thousands of graphs, custom reports, and special features to help with performance analysis, server consolidation, and upgrades. No need to replace your performance methodology! Performance Navigator can coexist as the sharpest tool in your belt.
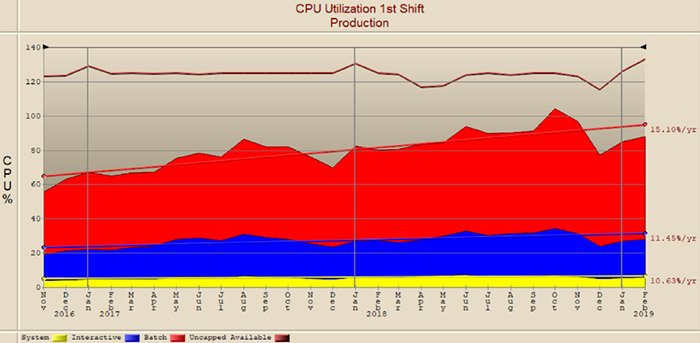
Performance Navigator allows you to view historical system performance data trends easily from your Windows PC.
Industry Standard for System Sizing
Performance Navigator is the industry standard for system sizing. IBM business partners and end users around the world rely on its trademark What If functionality to facilitate server consolidations and hardware upgrade projects.
Based on days, months, or years of historical performance and capacity data stored on your system, the What If feature allows you to model hypothetical scenarios and determine how capacity changes will impact server performance, so you can make capacity planning decisions with precision.
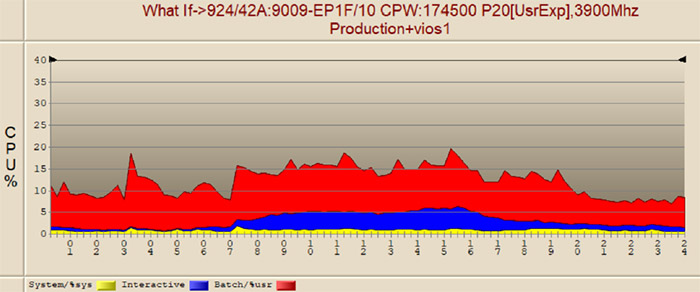
Capacity plan with confidence with Performance Navigator’s What If capability.
Swift Problem Determination
Whether it’s a current system slowdown or a need to understand what happened to the system at 2:00 a.m. last night while you were asleep, you can use Performance Navigator to get a fast and thorough problem determination summary in under two minutes.
Even organizations who just completed an upgrade or are only considering a development machine can have performance issues. With Performance Navigator installed on your systems, you can drill down into end-of-day and end-of-month activity or long backups to analyze system performance and make improvements.
Or, the next time you innocently install a new software release or apply a PTF and performance takes a nose dive, you could have all answers at your fingertips instead of wasting time searching for the problem. Performance Navigator makes it possible!
Measurement for the Impact of Change
Whether it’s a planned change or a situation where you discover that something has changed on one of your production machines, the What’s Different Analysis feature in Performance Navigator shows a before-and-after analysis, so you can easily identify what’s different between good days and bad days.
You can report on the top jobs and processes—including the user name for the process—as well as enterprise disk space and multi-system job comparisons. This valuable insight will help you understand the impact of any change inside your virtualized IT world.
Automated Graphs and Reports
Whether you want to look at the whole frame or examine a shared pool, Performance Navigator makes it easy to produce management-friendly graphs and reports. Instead of sifting through the thousands of graphs and reports available in Performance Navigator, you can set up a performance reporting dashboard for each partition. Alternatively, you can flag the ones you need most often by creating a report set and scheduling it to run via Windows Task Manager or another scheduling tool.
Performance Navigator gives you the flexibility to create a quick, professional report from any graph or window. Personalized comments can be added to each saved page and you can customize all output with your company logo and colors. A recommendations or summary page can be included for each personalized report and all output packages can be saved for modification later.
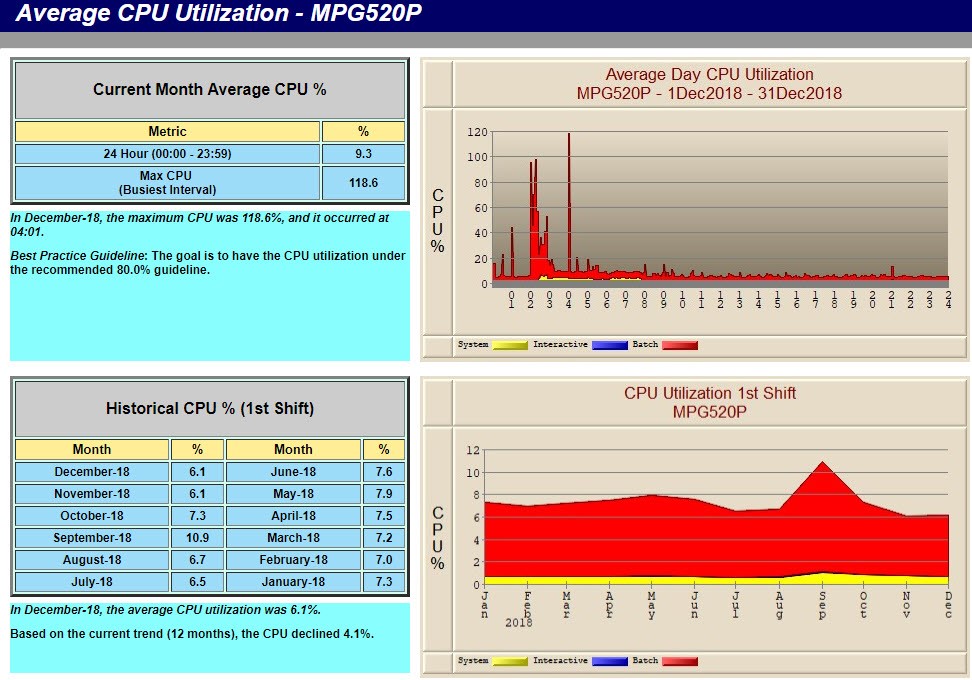
Power Analytics enables you to understand your systems at a deeper level by providing enterprise performance reporting.
Get Started
The historical performance data on your servers is a treasure trove of information regarding actual usage over time. But you must access and interpret this data to get to the bottom of performance issues or inform future hardware investments. Performance Navigator can help! Request a live demonstration and we’ll show you how.